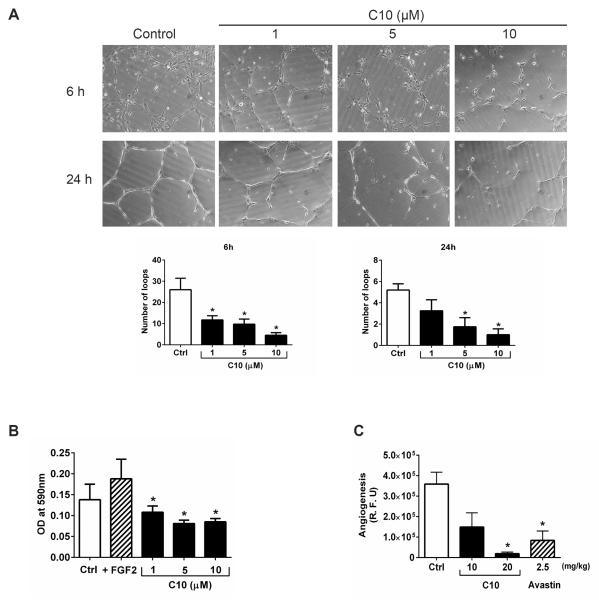
Figure 5. Anti-angiogenic activity of FAK inhibitor C10.
(A) HUVEC cells were plated on basement membrane extract coated wells and treated with DMSO (control) or C10 at the indicated concentrations. Capillary tube formation was then assessed at 6 h and 24 h and the number of loops were analyzed from 7–10 fields for each condition. Representative images from three independent experiments are shown. Error bars represent mean ± S.D. *p <0.05. (B) Transwell plates were used to determine HUVEC cell motility following DMSO (control) or C10 treatment at the indicated concentrations for 24 h. FGF2 was included as a positive control. Migrated cells were stained followed by dye extraction and the absorbance (590 nm) was measured for each condition. Data are presented as mean ± S.D. of three experiments. *p <0.05. (C) The effect of C10 on in vivo angiogenesis was evaluated using the directed in vivo angiogenesis assay (DIVAA). Angioreactors (n=4) were prepared and implanted as described in the Materials and methods. Avastin was included as a negative control. The extent of endothelial cell invasion in the angioreactors for each condition was determined by fluorescence quantitation of FITC-Lectin and is reported as relative fluorescent units (R.F.U). Results are shown as mean ± S.D. *p <0.05.

