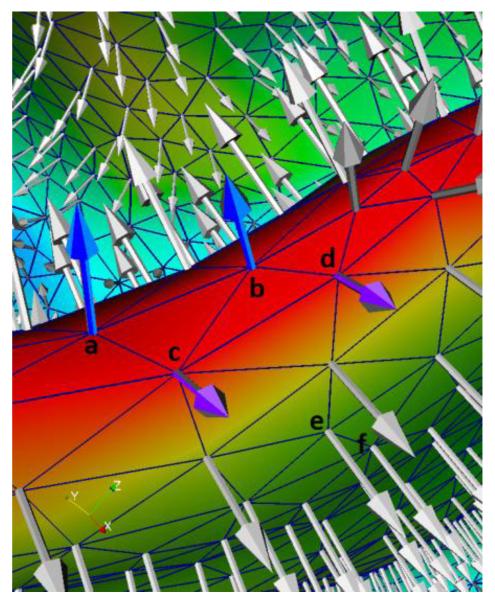
Fig. 4.
An illustration of the mean curvatures and normal directions at different cortical regions. Note that this cortical region is viewed from the inside to the outside of the brain for convenience of inspection. The red color region indicates the sulcal bottom, and the green color region indicates the flat cortical region. Vertices a and b are in the same cortical region, and c and d are in another cortical region.

