
Figure 5.
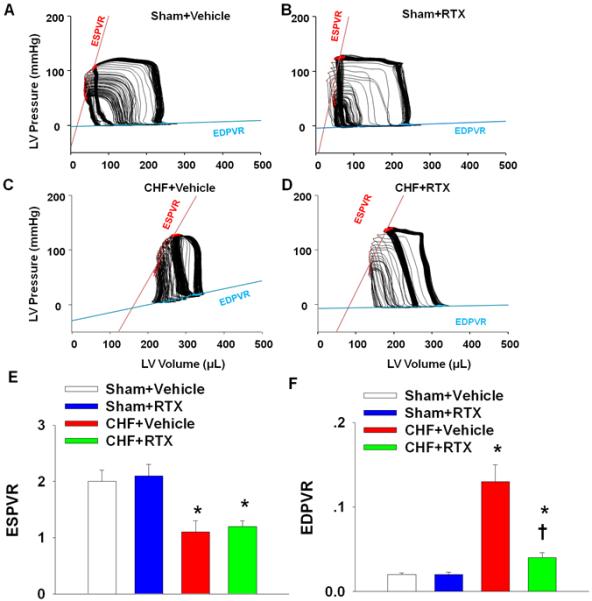
A-D, original 10-sec recordings of steady state P-V loops obtained with a Millar P-V conductance catheter system from sham+vehicle, sham+RTX, CHF+vehicle and CHF+RTX rats. E and F, mean data showing the effect of RTX on the systolic (ESPVR, E) and diastolic (EDPVR, F) function that are independent of systemic vascular resistance in sham and CHF rats. Data are expressed as mean±SE. n=7-8/each group. *, P<0.05 vs. sham+vehicle, †, P<0.05 vs. CHF+vehicle.