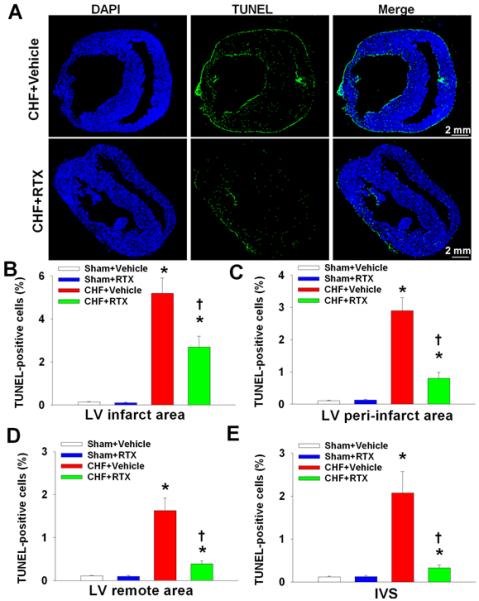
Figure 6.

Representative scanning images (A) and mean data (B-D) showing TUNEL-positive staining in LV infarct, LV peri-infarct, LV remote and IVS regions from sham+vehicle, sham+RTX, CHF+Vehicle and CHF+RTX rats. Data are expressed as mean±SE. n=5-6/each group. *, P<0.05 vs. sham+vehicle, †, P<0.05 vs. CHF+vehicle.
