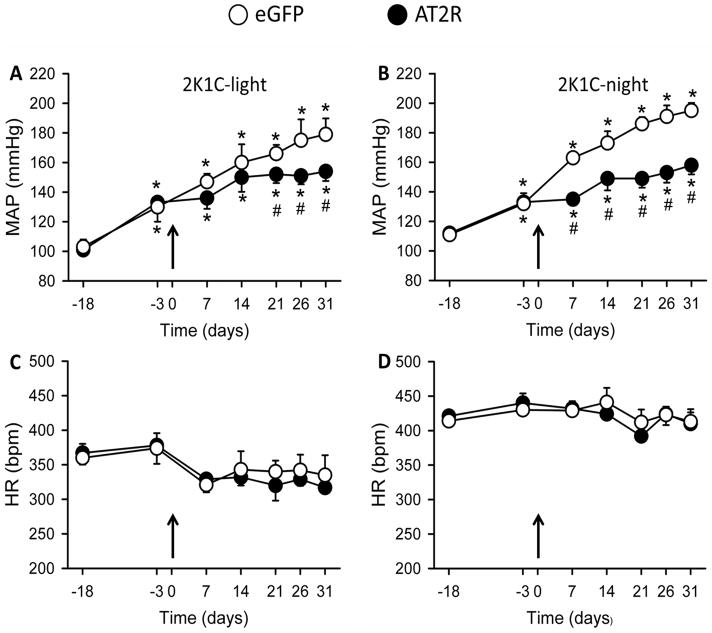
Figure 2. Increased AT2R expression in the NTS/DMV decreases the development of hypertension in renovascular hypertensive rats.
Shown here are MAP (mmHg) values from two-kidney one clip (2K1C) rats recorded on the days indicated before and after vector injections (AAV2-CBA-eGFP, open symbols; AAV2-CBA-AT2R, filled symbols) into the NTS/DMV. MAP recordings were made during the light (A and C) and dark periods (B and D), and vector injections were made on Day 0 (indicated by the arrows). The results are presented as means ± SEM; n = 5 and 6 rats for the eGFP and AT2R groups, respectively. *p < 0.05 vs. baseline (Day -18); # p < 0.05 vs. eGFP.

