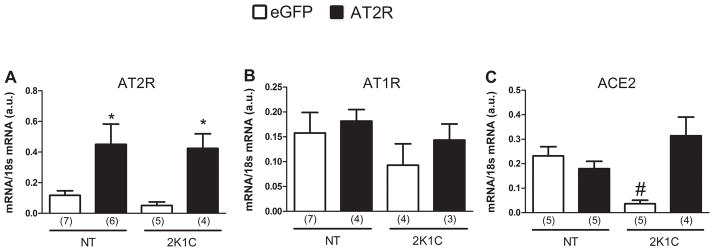
Figure 4.

AT2R, AT1R and ACE2 mRNA levels in the NTS of 2K1C and normotensive rats. Following euthanization of the rats used in the Experiment in Figure 3, brains were removed, and mRNA levels of ANG II receptors and ACE2 in the NTS/DMV were assessed by real-time RT-PCR. The results are presented as means ± SEM; n is indicated in parentheses; *p < 0.05 vs. eGFP; # p < 0.05 vs. all groups.
