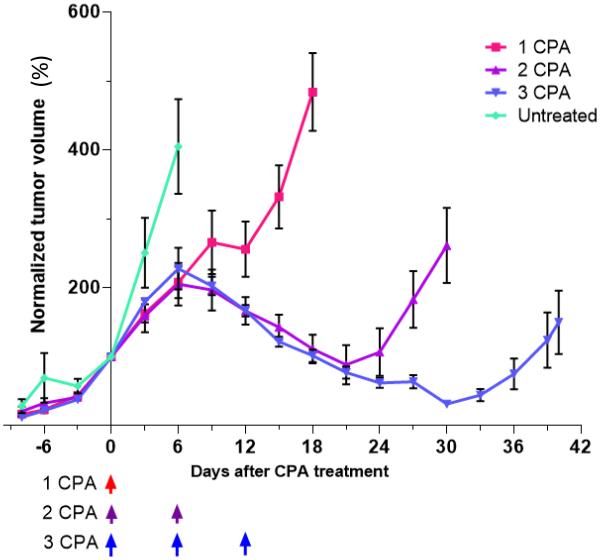
Fig. 1.
Growth curves of GL261 tumors that were untreated, or were given 1, 2, or 3 CPA injections on the CPA/6d schedule. Data shown are tumor volumes normalized to 100% on the first day of drug treatment (=day 0), mean ± SEM, for n = 6-8 tumors/group, except for 1 cycle CPA, where n=4. Arrows at bottom indicate days of CPA treatment at 140 mg/kg-BW. The measured tumor volumes on day 0 were 685 ± 55 mm3, 785 ± 370 mm3, 715 ± 105 mm3 (mean ± SEM) for the groups given 1, 2, and 3 CPA injections, respectively.

