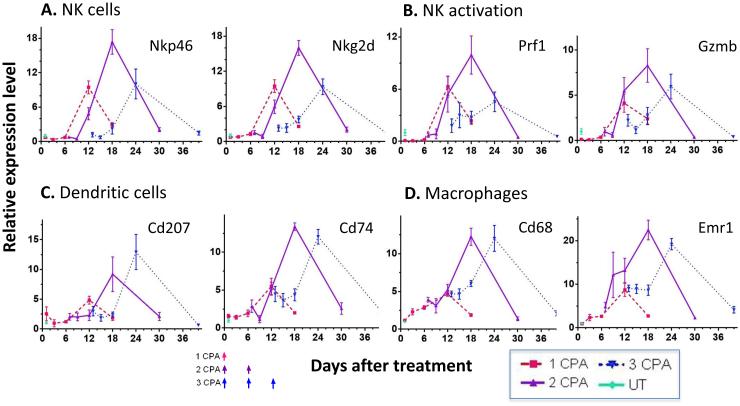
Fig. 2.
Time courses of changes in innate immune cell marker gene expression assayed by qPCR in GL261 tumors treated as in Fig. 1. Tumors were sampled 1, 3, 6 and 12 days after the last CPA injection, and at one additional time point, when strong tumor regrowth was evident (days 18, 30 and 40, for 1, 2 and 3 CPA injections, respectively; see Fig. 1). (A) NK cell markers Nkp46 and Nkg2d, (B) NK cell activation markers Prf1 and Gzmb, (C) dendritic cell markers Cd207 and Cd74, and (D) macrophage markers Cd68 and Emr1 (F4/80). The third CPA injection reduced NK cell marker expression compared to the level just prior to injection (day 13 vs. day 12; see Table 1). Gene expression levels relative to 18S rRNA over the time course (X-axis) were normalized to the mean of untreated tumors on day 1. Y-axis values are relative expression levels of each gene, mean ± SEM, for n = 4 to 8 tumors per time point.

