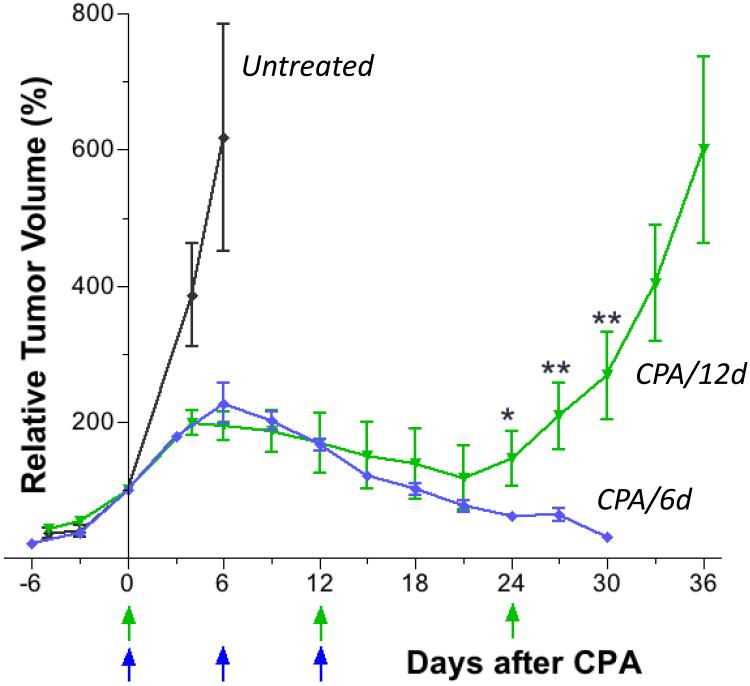
Fig. 4.
Growth curves for GL261 tumors in mice given a total of 3 CPA injections on the CPA/12d schedule. Data are directly compared to the growth curve for 3 cycles of CPA/6d treatment, reproduced from Fig. 1, to highlight the divergence of responses beginning on day 24. Data shown are normalized tumor volumes, mean ± SEM, n = 8 for tumors in the CPA/6d group, n = 9 for tumors in the CPA/12d group. Tumor volume on the first day of CPA/12d treatment (day 0) = 610 + 130 mm3 (100%). Normalized tumor volumes in the CPA/12d group on days 24, 27, and 30 were significantly larger than in the CPA/6d group (*, p<0.05; **, p<0.01, by one-tailed t-test).

