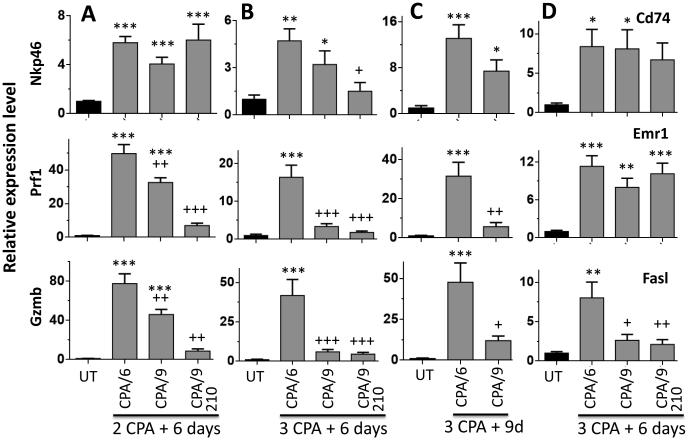
Fig. 6.
NK cell recruitment and NK cell activation status in metronomic CPA-treated GL261 tumors. qPCR analysis of the indicated marker genes in tumors collected 6 days after two CPA injections (A), 6 days after three CPA injections (B), or 9 days after three injections (C) given on the indicated schedules: CPA/6d, CPA/9d and CPA(210)/9d. Data shown are relative expression levels, mean ± SEM: panel A, n = 18 (untreated), n = 20 (CPA/6d), n = 24 (CPA/9d), and n = 4 (CPA(210)/9d); panels B and C, n = 5 to 8 tumors per group. Significance when compared to untreated tumors: *, p<0.05; **, p<0.01; ***, p<0.001 (one-way ANOVA). Significance when compared to CPA/6d treatment: +, p<0.05; ++, p<0.01; +++, p<0.001 (one-way ANOVA for comparisons involving 3 or more groups; two-tailed t-test for comparisons limited to 2 groups).

