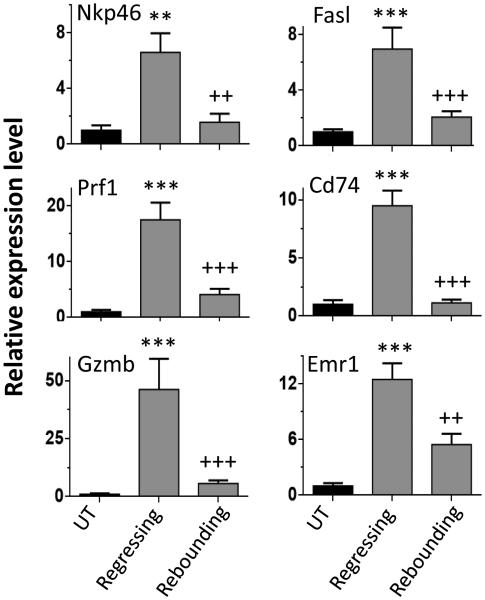
Fig. 7.
NK cell marker Nkp46, NK cell activation markers Prf1, Gzmb, and Fasl, dendritic cell marker Cd74, and macrophage marker Emr1 in regressing GL261 tumors compared to rebounding GL261 tumors. Data shown are relative expression levels normalized to the mean values for untreated tumors, mean ± SEM. n = 4 for untreated tumors, n = 5 regressing tumors, and n=18 rebounding tumors, as in Fig. 5B. Significance when compared to untreated tumors: *, p<0.05; **, p<0.01; ***, p<0.001. Significance when comparing regressing tumors vs. rebounding tumors: +, p<0.05; ++, p<0.01; +++, p<0.001 (one-way ANOVA).

