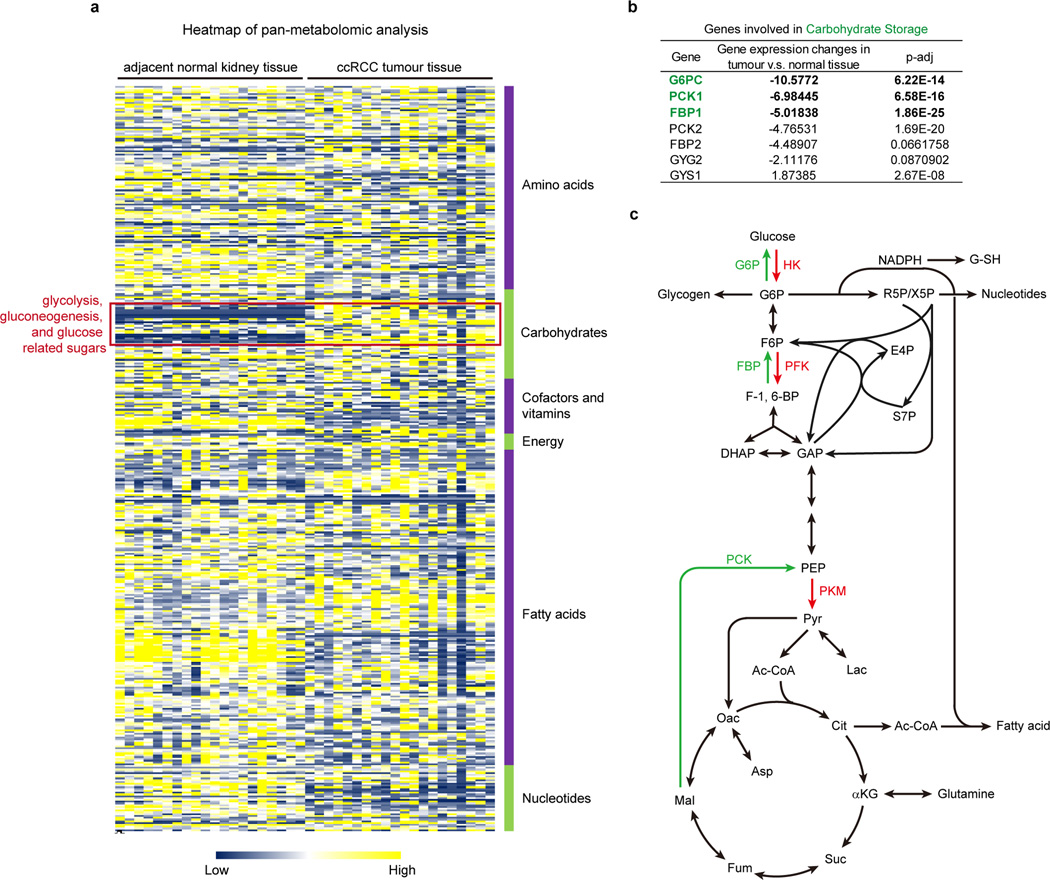
Extended Data Figure 1. Pan-metabolomic analysis of ccRCC tumour and adjacent normal kidney tissues.
a, Heatmap showing the relative concentration of 418 metabolites detected in 20 primary ccRCC tumours and adjacent normal kidneys. Metabolites were extracted from frozen tissue samples and analysed by the Thermo-Finnigan GC-MS and LC-MS/MS systems. Raw data of each metabolite was rescaled to set the median equal to 1. All metabolites were clustered according to their related pathways (based on KEGG) and then plotted as a heatmap. b, Metabolic genes involved in “carbohydrate storage” differentially expressed in ccRCC tumour vs. normal tissue. G6PC, glucose-6-phosphatase, catalytic subunit; PCK1, phosphoenolpyruvate carboxykinase 1; FBP1, fructose-1, 6-bisphosphatase 1. c, Illustration of central carbon metabolism, including glycolysis, gluconeogenesis, pentose phosphate pathway, and the TCA cycle. Enzymes controlling glycolysis (HK, hexokinase; PFK, phosphofructokinase; PKM, pyruvate kinase type M) are highlighted in red, while enzymes controlling gluconeogenesis (G6P, glucose-6-phosphatase; FBP, fructose-1, 6-bisphosphatase; PCK, phosphoenolpyruvate carboxykinase) are highlighted in green. G6P, glucose 6-phosphate; F6P, fructose 6-phosphate; F-1, 6-BP, fructose 1, 6-bisphosphate; DHAP, dihydroxyacetone phosphate; GAP, glyceraldehyde 3-phosphate; R5P, ribose 5-phosphate; X5P, xylulose 5-phosphate; E4P, erythrose 4-phosphate; S7P, sedoheptulose 7-phosphate; PEP, phosphoenolpyruvate; Pyr, pyruvate; Ac-CoA, acetyl-CoA; Lac, lactate; Cit, citrate; αKG, alpha-ketoglutarate; Glu, glutamate; Suc, succinate; Fum, fumarate; Mal, malate; Oac, oxaloacetate; Asp, aspartate; G-SH, reduced glutathione.

