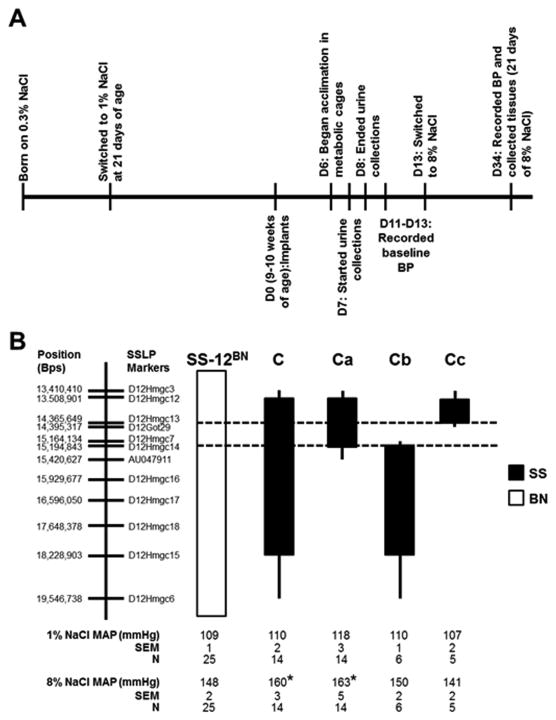
Figure 1.
Experimental timeline for diet switches, urine collection, blood pressure measurements, and tissue collections (A). D0, day of transmitter implants; D#, number of days post-implant. B, Schematic representation of the overlapping salt-sensitive (SS)-12BN congenic strains that were generated by introgressing segments of the SS chromosome 12 (black) into the genetic background of the SS-12BN consomic rat (white) by marker-assisted breeding. Mean arterial pressure (MAP) of the congenic strains while on 1% NaCl diets and stressed for 3 weeks on 8% NaCl diets. Data were analyzed by 1-way ANOVA on ranks followed by Dunn's multiple comparison test. The sample size for each group is shown in the figure. The dashed lines indicate the boundaries (markers D12Hmgc13 to D12Hmgc14) of the narrowed candidate region after excluding the Cb and Cc genetic regions. The thin black bars represent chromosomal regions that could be either BN or SS. There were no statistical differences between the strains on 1% NaCl.*P<0.05 vs. SS-12BN on 8% salt diet.

