
Fig. 1.
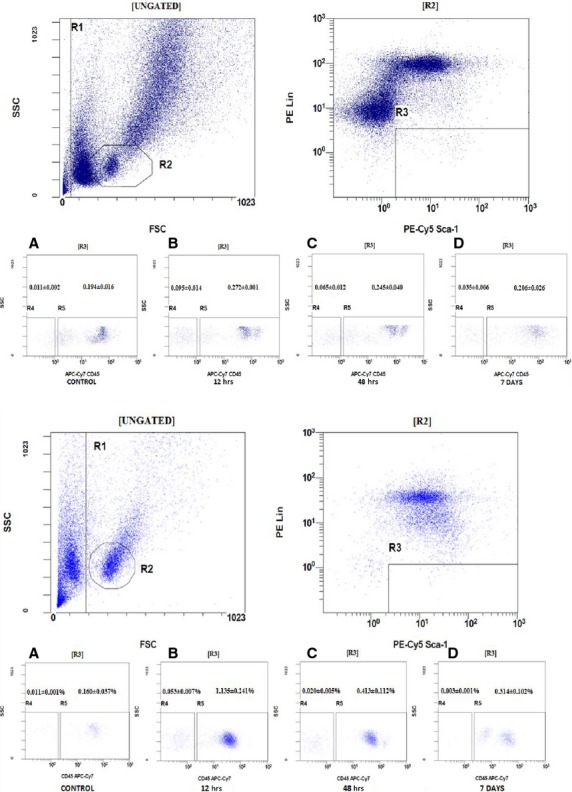
Representative example of flow cytometry analysis of the VSELs and HSCs residing in bone marrow (upper panel) and after their mobilization into peripheral blood (lower panel) in mice from group C (kainic acid 25 mg/kg bodyweight). (A) The number of VSELs (gate R4) versus HSCs (gate R5) in the control group. (B) The number of VSELs (gate R4) versus HSCs (gate R5) in subgroup II, in which the analysis was performed 12 hrs after injection of kainic acid. (C) The number of VSELs (gate R4) versus HSCs (gate R5) in subgroup IV, in which mice were analysed 48 hrs after injection of kainic acid. (D) The number of VSELs (gate R4) versus HSCs (gate R5) in subgroup V, in which the analysis was performed 7 days after injection of kainic acid.