
Fig. 3.
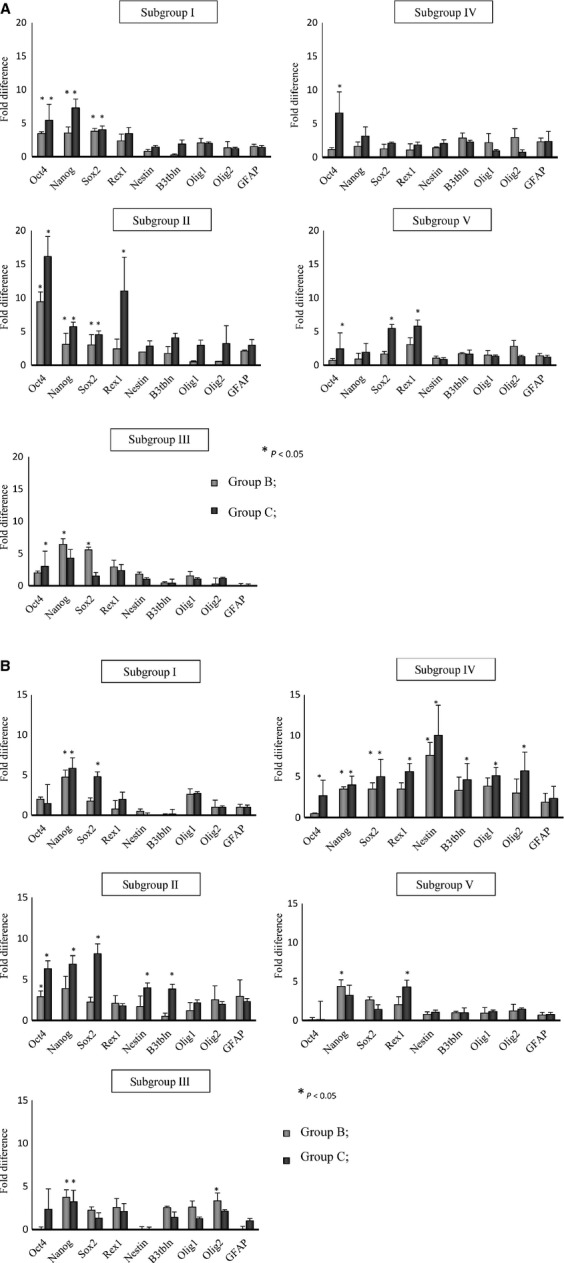
RQ-PCR analysis of the expression of selected genes in cells isolated from bone marrow (A) and peripheral blood (B) from mice in groups B and C. The cells were isolated from subgroup I at 6 hrs, subgroup II at 12 hrs, subgroup III at 24 hrs, subgroup IV at 48 hrs and subgroup V at 7 days after injection of kainic acid. Group B, animals that received kainic acid at a dose of 15 mg/kg b.w, and Group C, at 25 mg/kg b.w. Fold changes in gene expression are shown relative to expression in the control group, which was assumed to be 1.0. Combined data from three independent experiments are shown. *P < 0.05. Data from experiments with lowest dose of kainic acid (8.5 mg/kg/b.w.) are shown in Figure S5A and B.