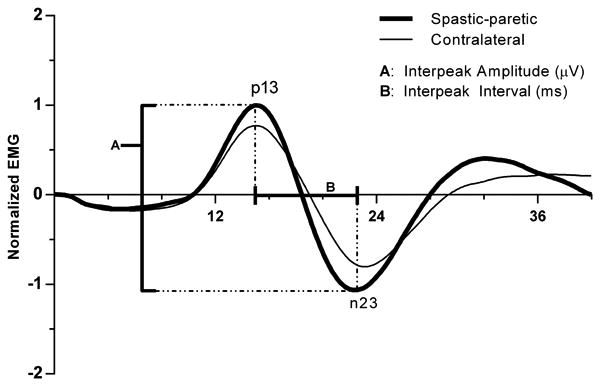
Figure 2.

Population spastic-paretic and contralateral cVEMPs recorded in response to monaural acoustic stimulation (128 short tone bursts; 500 Hz; 95 dB nHL; 1 ms rise/fall; 2 ms plateau; 5/s). A peak was labeled p13 if it occurred between 10 and 20 ms and exceeded two standard deviations above baseline based on the pre-stimulus unrectified EMG (50 ms). The subsequent peak of opposite polarity immediately following p13 was designated as n23. The interpeak amplitude (A) was calculated as the difference been the p13 and n23 peaks. The interpeak interval (B) was calculated by subtracting the latency of p13 from n23. To normalize, the interpeak amplitude was divided by the mean rectified pre-stimulus EMG (50 ms).
