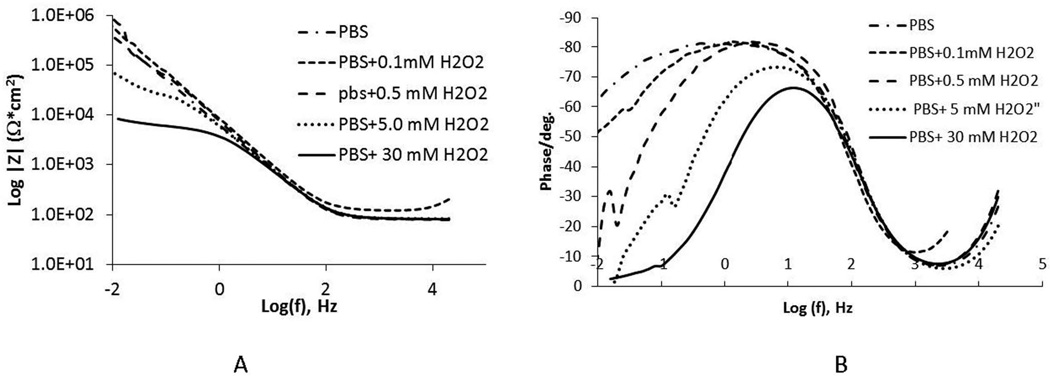
Figure 10.
Impedance analysis results for CoCrMo in PBS containing differing concentations of H2O2. A) impedance versus log of the frequency, B) phase angle versus log of the frequency. Note, that small increases in H2O2 concentrations in pH 7.4 PBS result in large (two orders of magnitude) decrease in the low frequency impedance, reflective of the oxide resistance, of the surface.

