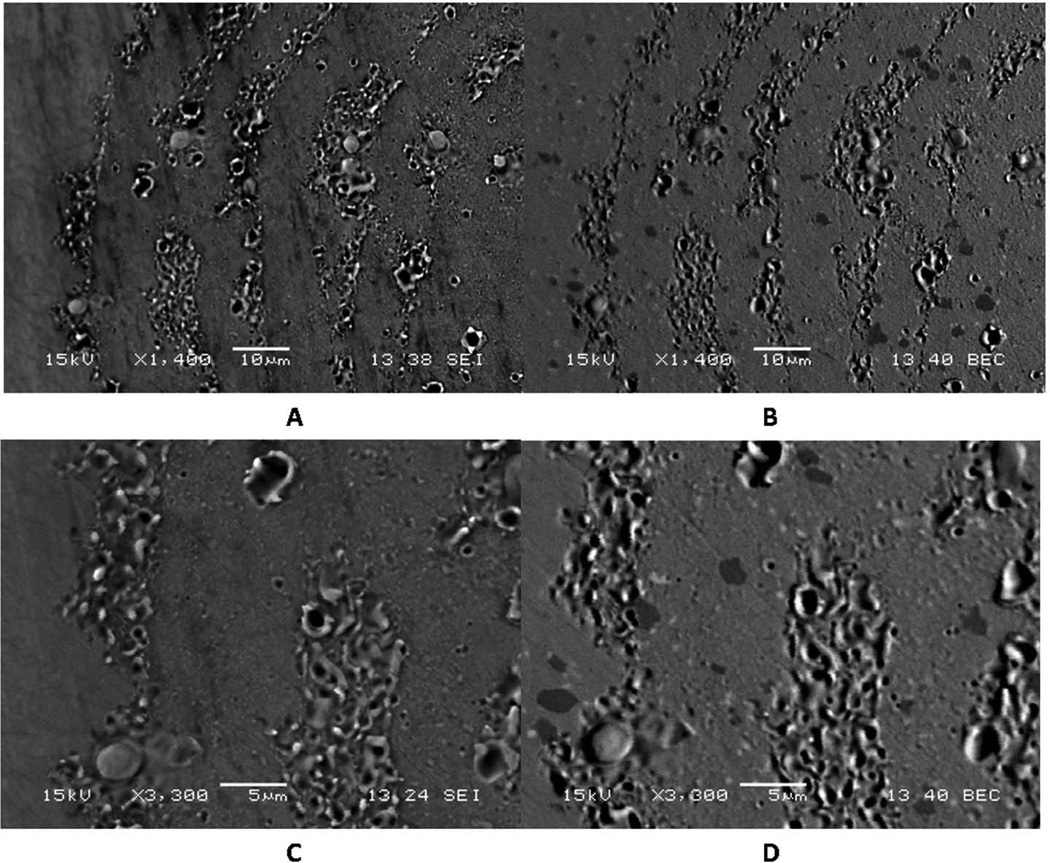
Figure 4.
SEM micrograph pairs showing details of corrosion patterns described in Fig. 3. A) SEI and B) BEC images of the same region showing the concentric rings of corrosion. C) SEI and D) BEC images under higher magnificent of the same regions. Note the fine biologically-driven corrosion patterns as well as the underlying microstructure of the CoCrMo alloy exhibiting carbides and other features of the microstructure and its interaction with the ICI corrosion.

