
Fig. B2.
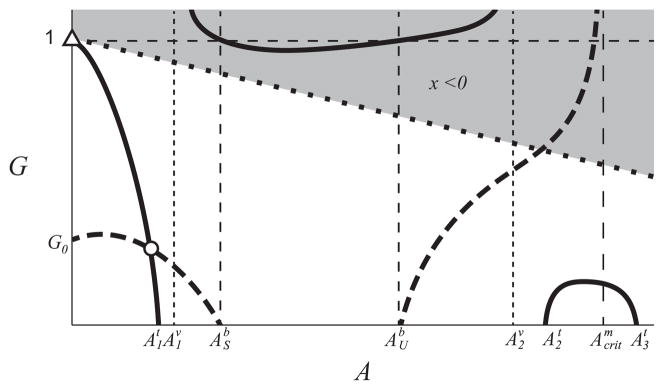
Qualitative sketch of the curves G1 (dashed black curve) and G2 (solid black curve). The position of non-trivial equilibrium points projected to (A, G) plane is at the intersections of these curves. Equilibria are marked with a circle for a stable equilibrium point and a triangle for an unstable saddle. The trivial (x=0) equilibrium point at (0,1) is shown. In the shaded gray region (G>1−A/(1+γ)) any solutions are physically unrealistic as x<0. The vertical asymptote of the curve f(G)I(A)+m(A) = 1 is labeled .