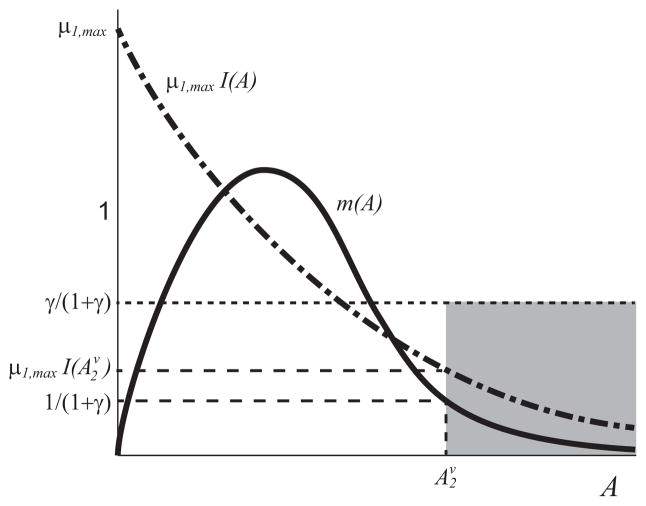
Fig. 3.
Qualitative sketch of the curves m(A) (solid black curve) and μ1,maxI(A) (dot-dash black curve) that satisfy the sufficient condition in Theorem 2c ruling out the upper monoculture equilibria. The curve μ1,maxI(A) lies in the shaded region defined by the value , where is the upper solution of m(A) = 1/(1 + γ).

