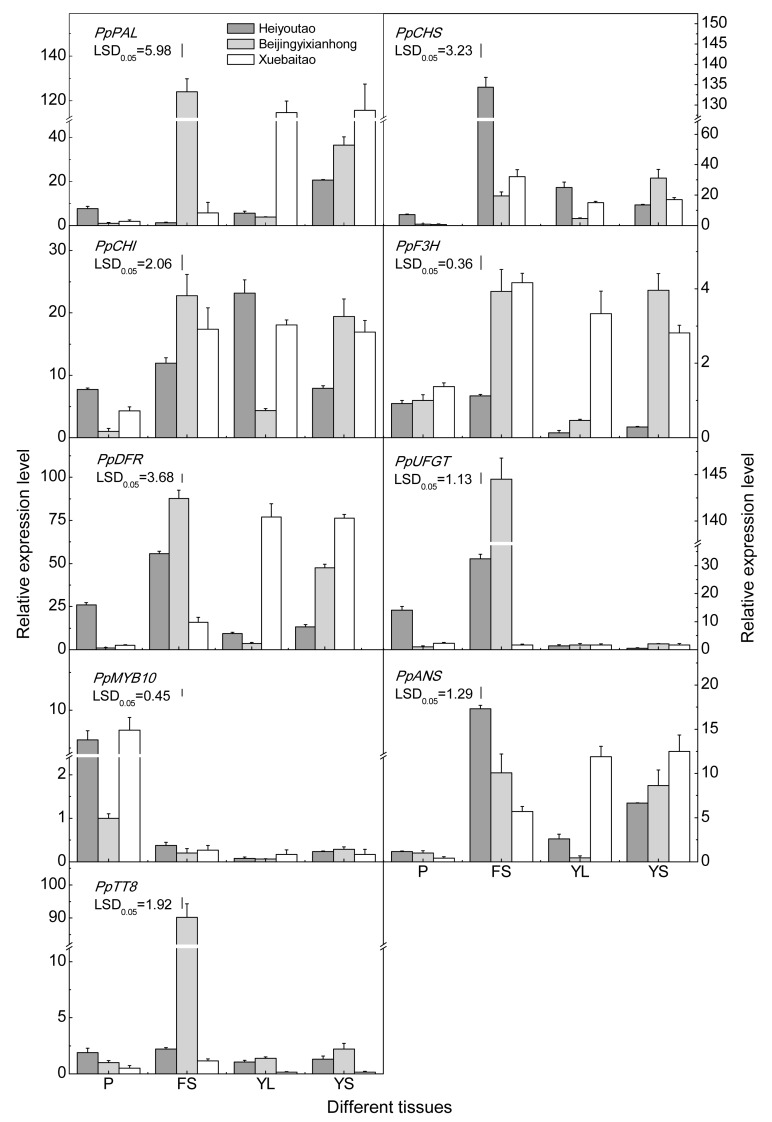
Fig. 7.
Expression analysis of the anthocyanin biosynthetic genes in various organs and tissues
The expression levels of the UBQ10 and TEF2 genes were used to normalize the expression of all other genes under identical conditions. P: petal; FS: fruit skin; YL: young leaf; YS: young stem. The vertical bars represent the standard error (SE) of three replicates

