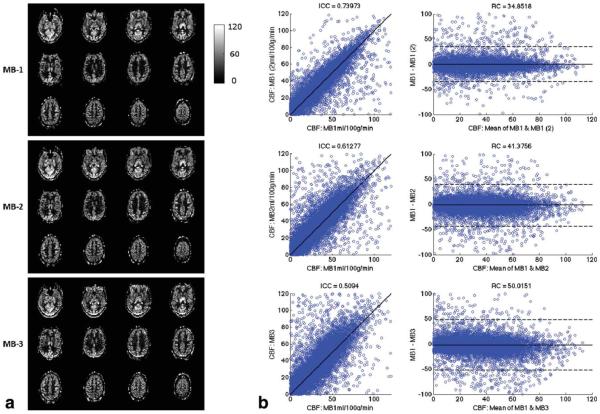
FIG. 3.
Quantitative CBF maps acquired with MB-1, MB-2, and MB-3 SMS-EPI ASL with 12 slices covering a 72-mm slice volume from a second subject. a) CBF maps. b) Scatter plot and Bland-Altman plots showing the pixel-wise comparison of MB-1 versus MB-1, MB-1 versus MB-2, and MB-1 versus MB-3. Two separate MB-1 scans were used to establish a relative measure for comparisons.

