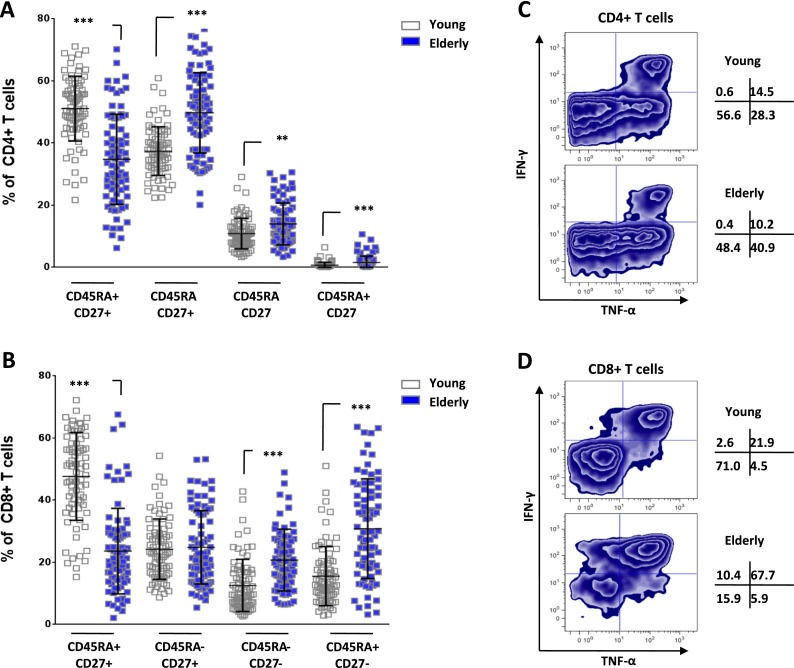
Fig. 2.
Impact of aging on T cell phenotype and function. PBMCs were separated from blood collected from young (n = 15) and elderly (n = 15) individuals. Cells were stained for CD3, CD4, CD8, CD27, and CD45RA expression using directly conjugated antibodies and analyzed by flow cytometry. a The CD4+ T cell subset distribution (based on CD45RA and CD27 expression) of young (empty bars) and elderly individuals (filled bars) is shown with significant differences (**p < 0.01 and ***p < 0.0001). b The same analysis and significance were reported for the CD8+ population. c PBMCs were stimulated with PMA/ionomycin for 4 h and stained for surface CD3, CD4, CD8, and intracellular TNF-α and IFN-γ. We provide a representative plot of CD4+ T cells from young and elderly individuals. d The same analysis was performed for CD8+ T cells on the same donors as in c. Numbers shown represent the distribution of TNF-α and IFN-γ producing cells

