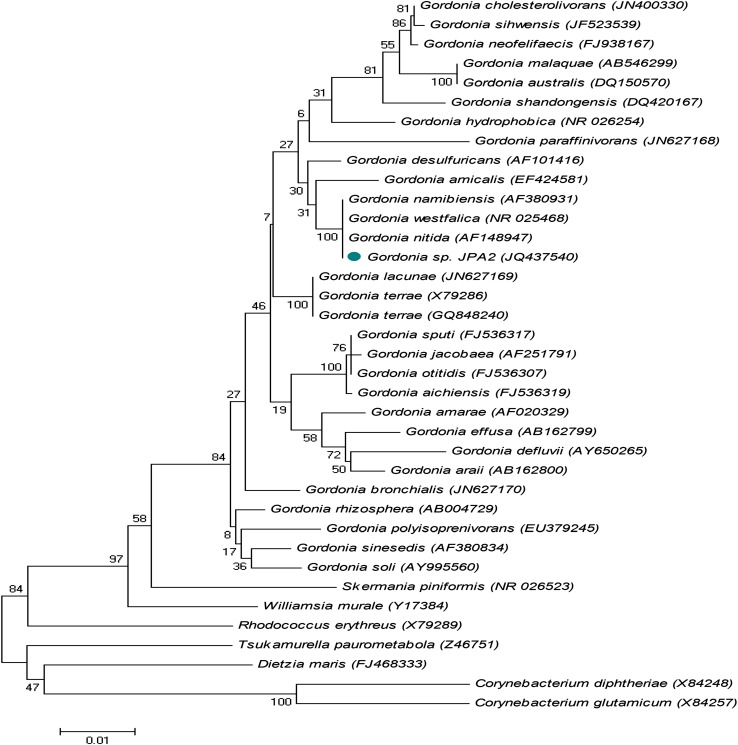
Fig. 1.
Phylogenetic tree showing the position of strain JPA2 Gordonia species and some other related taxa based on 16S rRNA gene sequences. Distances were calculated by neighbor-joining method. Bootstrap values (expressed as percentages of 1,000 replications) are shown at branch points. Genbank accession numbers are given in parentheses. The scale bar indicates 0.01 substitutions per nucleotide position

