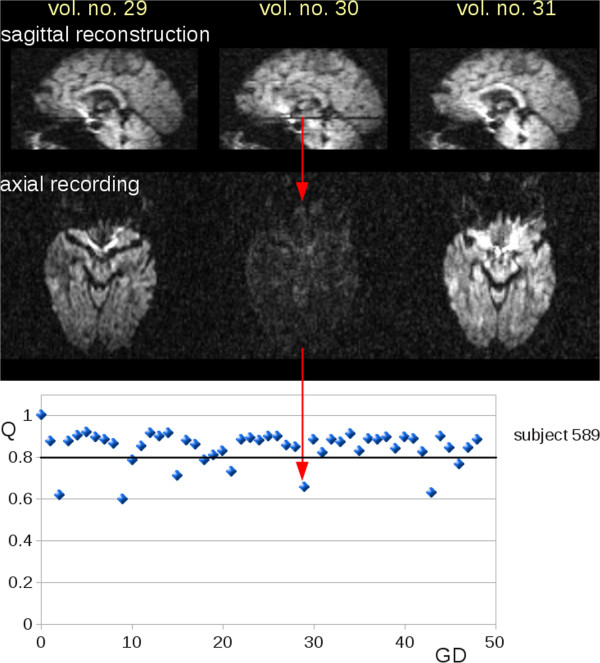
Figure 2.

Corrupted slices in DTI volumes. DTI data (volumes number 29 to 31) of an HD subject (subject 589). Upper panel: reconstructed central sagittal slice where axial slices affected by noise are visible (volume number 30). Lower panel: With a QC-threshold of Q = 0.8, nine gradient directions (GD) were detected as corrupted by noise.
