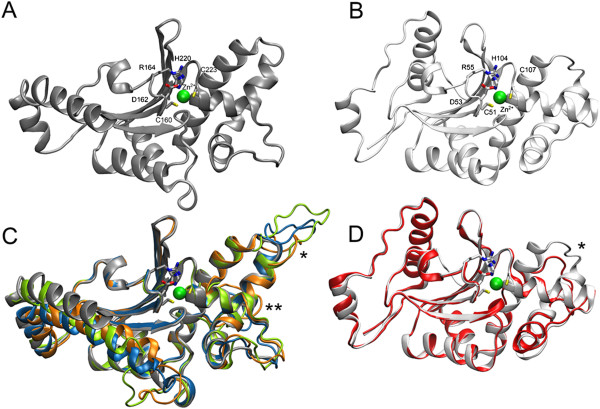
Figure 3.

Homology modelling. (A) Cartoon presentation of β-CA from Pisum sativum (PDB 1EKJ). The Zn2+ion is shown as green sphere and the residues in direct contact with the ion are shown as liquorice models and labeled with residue numbers. (B) β-CA from Mycobacterium tuberculosis (PDB 2A5V, light gray). (C) Aligned homology models of β-CAs from Ancylostoma caninum (green), Ascaris suum (blue), and Trichinella spiralis (orange) are shown with PDB 1EKJ (gray). (D) Homology model of and Entamoeba histolytica (red) structurally aligned with PDB 2A5V (light gray). Highly variable loop regions are indicated by stars (“*” and “**”) (C, D). Insertion suggested by homology models of Ancylostoma caninum, Ascaris suum and Trichinella spiralis is indicated by three stars (C). The figure was prepared by using VMD (version 1.9.1).
