Figure 3.

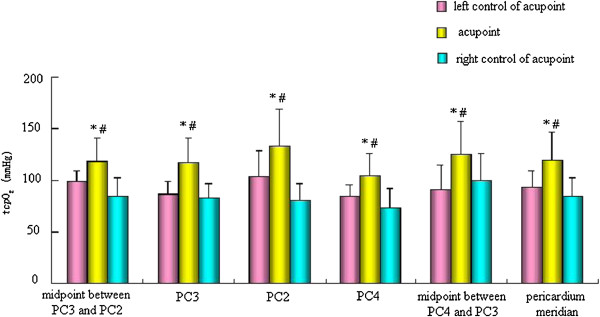
Comparison of tcp O 2 of the pericardium meridian and its bilateral control points in the normal state. *p < 0.05 vs. left control of acupoint groups; # p < 0.05 vs. right control of acupoint groups.

Comparison of tcp O 2 of the pericardium meridian and its bilateral control points in the normal state. *p < 0.05 vs. left control of acupoint groups; # p < 0.05 vs. right control of acupoint groups.