
Figure 8.
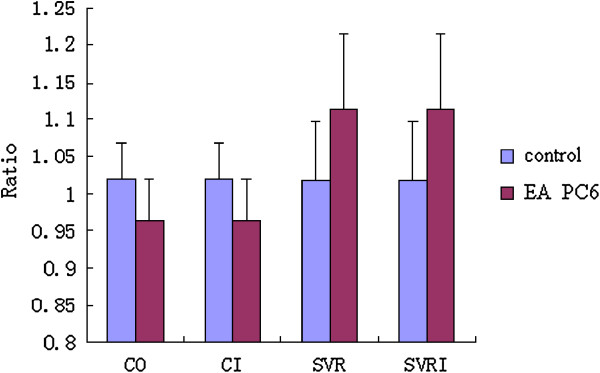
Effect of EA at PC6 on cardiac functions. The results are showed as a ratio. The ratio was calculated by comparing the detection value to the control value.
Official websites use .gov
A
.gov website belongs to an official
government organization in the United States.
Secure .gov websites use HTTPS
A lock (
) or https:// means you've safely
connected to the .gov website. Share sensitive
information only on official, secure websites.
Effect of EA at PC6 on cardiac functions. The results are showed as a ratio. The ratio was calculated by comparing the detection value to the control value.