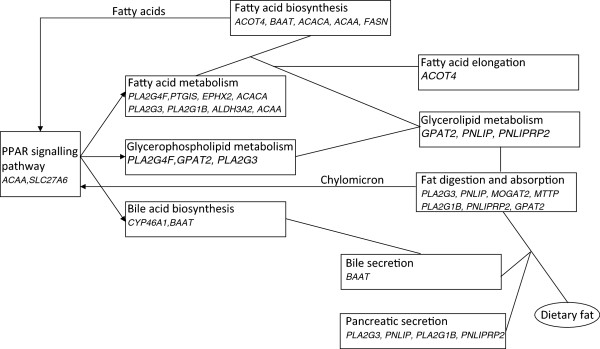
Figure 6.

Fat metabolic pathways and participating genes with Mangalica-specific exonic, non-synonymous SNPs. Lines represent the interconnections of the pathways. Arrows indicate where signalling or metabolites (name above the line) affect genes in other pathways.
