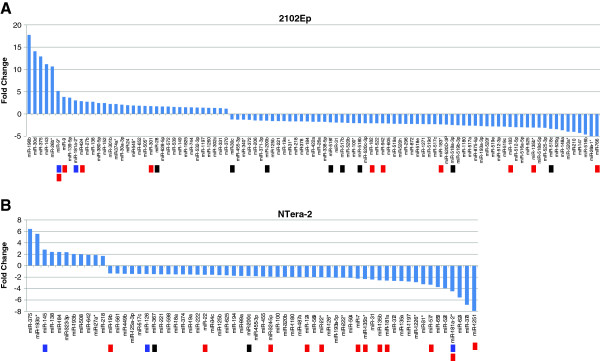
Figure 2.

Differential expression of miRNA in 2102Ep and NTera-2 cell lines after induced SOX2 silencing. Total number of all significantly (P ≤ 0.05) deregulated miRNA three days after SOX2 knock-down in 2102Ep (A) and NTera-2 cells (B) normalised to the respective miRNA expression in cells transfected with a non-targeting control. 99 and 62 miRNAs were deregulated in 2102Ep and NTera-2 cells respectively. Both charts visualise a substantial bias towards miRNA downregulation after the knock-down of SOX2. These charts represent the mean expression values across three biological replicates. Blue markers indicate miRNAs that form an autoregulatory loop with SOX2. Black markers indicate miRNAs found to be significant master regulators of differential gene expression in hECCs. Red markers indicate miRNAs with SOX2 binding sites in their promoters as found in this study.
