
Figure 1.
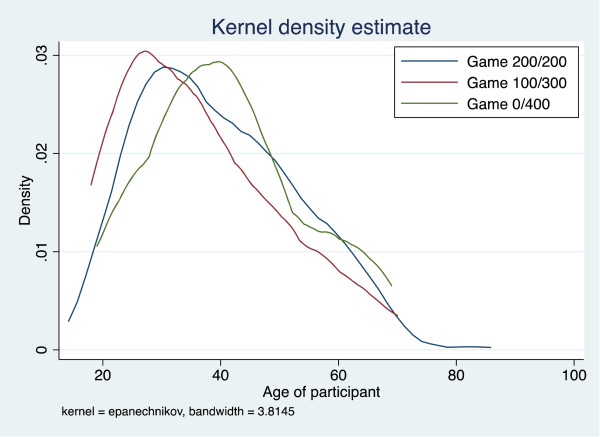
Kernel density distribution of participants’ ages by risk game chosen. Legend: Compared to 200/200 Naira group (blue), individuals choosing the 0/400 Naira game (green) were slightly older and those choosing the 100/300 Naira game (red) were generally younger; the full age profile of the 0/400 Naira group lies everywhere to the right of the 100/300 Naira group. Age distributions across risk games were significantly different (p = 0.015), tested using the Kruskal-Wallis equality-of-populations rank test.