
Figure 1.
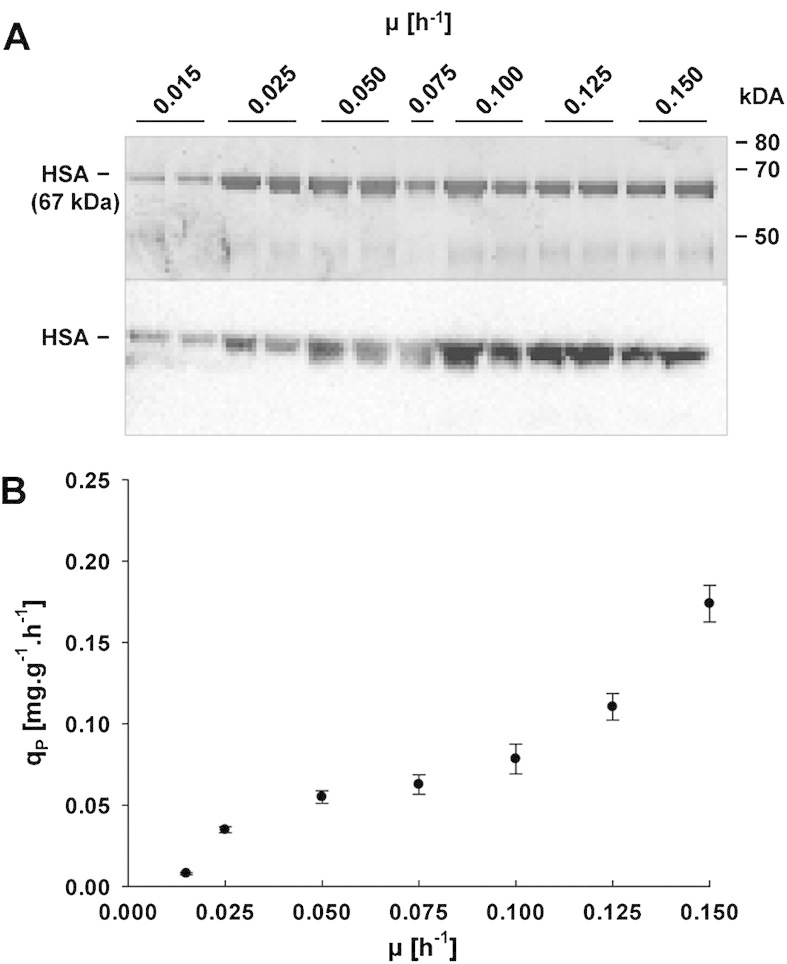
Recombinant HSA production by P. pastoris grown at different specific growth rates in glucose-limited chemostat cultures. (A) Representative SDS–PAGE (top) and corresponding anti-HSA western blot (bottom) under reducing conditions. Equal volumes of undiluted culture supernatants were loaded and visualized by silver staining or transferred to a nitrocellulose membrane for western blot analysis developed with HRP conjugated Human Albumin detection Antibody (A80-129P, Bethyl). For each growth rate setpoint (except for μ = 0.075 h–1) two samples from individual cultivations were analyzed. (B) Specific HSA secretion rate qP plotted against specific growth rate μ. The specific HSA secretion rate was calculated using mean product concentrations and yeast dry mass from three independent chemostat cultivations. All samples were analyzed in technical duplicates. Error bars represent standard error of the mean.