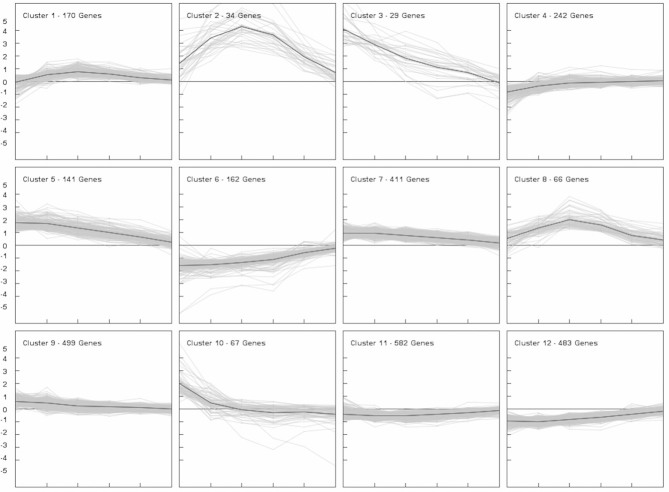
Figure 3.
Global gene expression profiles in P. pastoris grown at different specific growth rates in glucose-limited chemostat cultures. Genes that were differentially expressed when compared to the highest μ of 0.15 h–1 at least at one growth rate setpoint (adjusted p-value < 0.02, see Section 2) were grouped into 12 clusters using the k-means clustering algorithm. Relative expression levels (log2 scale, y-axis) are displayed for each gene at the different growth rate setpoints (x-axis) as well as the mean FC (black line). For every growth rate setpoint samples were collected from three individual cultivations and microarray experiments were performed in 2-color technical duplicates for every sample.

