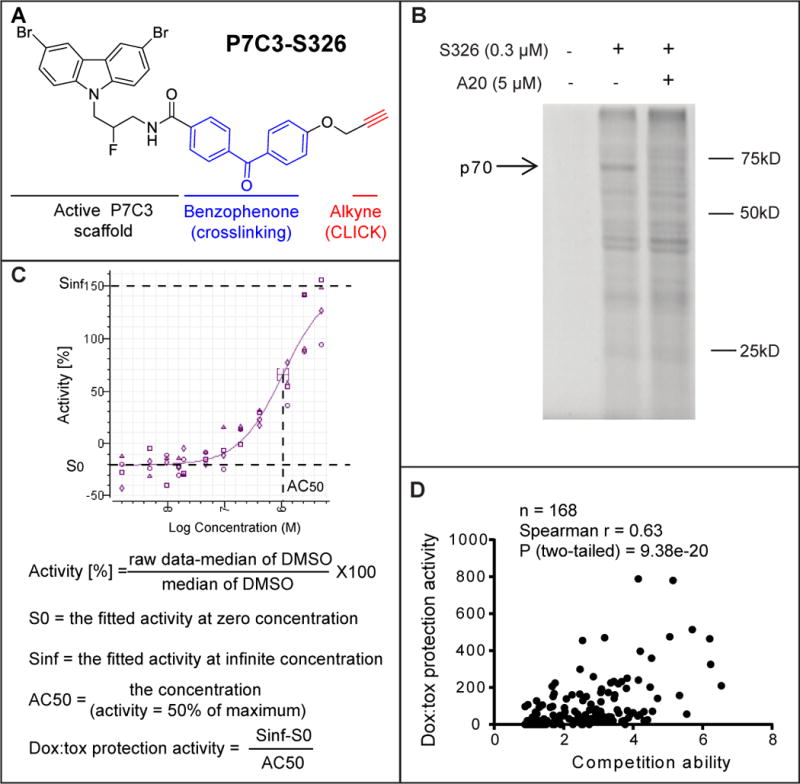
Figure 2. Identification of the P7C3 binding protein p70 using the P7C3-S326 photo-crosslinking probe.

(A) Chemical structure of P7C3-S326. (B) Full gel image of photo-crosslinking in H2122 cells with P7C3-S326 followed by click chemistry with Alexa 532 dye. The active analog P7C3-A20 competed away the UV-dependent binding of p70 to P7C3-S326. See also Figure S4. (C) Formulas used for calculating doxorubicin toxicity (dox:tox) protection activity. Protection activity is expressed by (Sinf-S0)/AC50 in the twelve-point dose response curve (DRC) corresponding to each compound, wherein both efficacy and potency of compounds were considered. Sinf represents the expected maximal protection. S0 is the baseline. AC50 is the concentration of a compound where 50% of its maximal protection effect was observed. See also Figure S3 and Table S2. (D) Scatter plot of 168 derivatives of P7C3 revealed a significant correlation between protective activity of P7C3 analogs from doxorubicin-mediated toxicity and their ability to compete for photo-crosslinking of P7C3-S326 to p70. In the photo-crosslinking assays, the p70 band intensity was quantified by Image J, and compared the sample of P7C3-S326 alone with that of P7C3-S326 plus competitor. Pearson correlation coefficient (r) and two tailed P value were determined by GraphPad Prism 6 and Spearman Rank Correlation (v1.0.1) software. See also Table S1.
