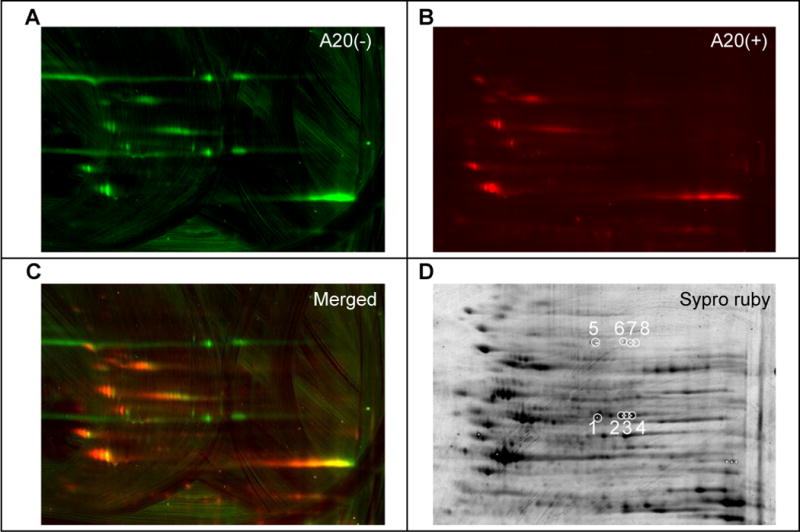
Figure 3. Identification of p70 and p55 targets of P7C3 by two-dimensional gel electrophoresis and mass spectrometry.

Lysates from cells exposed to 0.3 μM P7C3-S326 were CLICKed with a green dye, Alexa 532, and those from cells co-exposed to 0.3 μM P7C3-S326 and 5 μM of the active competitor P7C3-A20 were CLICKed with a red dye Cy5. CLICK reacted lysates were combined, subjected to two-dimensional gel electrophoresis, and scanned in the green channel (A) and the red channel (B). Images from both channels were merged to reveal green-only spots (C). After spot picking, total proteins were visualized by Sypro Ruby staining (D). White circles in (D) indicate spots excised for shotgun mass spectrometry analysis. See also Table S3.
