
Figure 1. Substrate Interaction with Hrd1p.
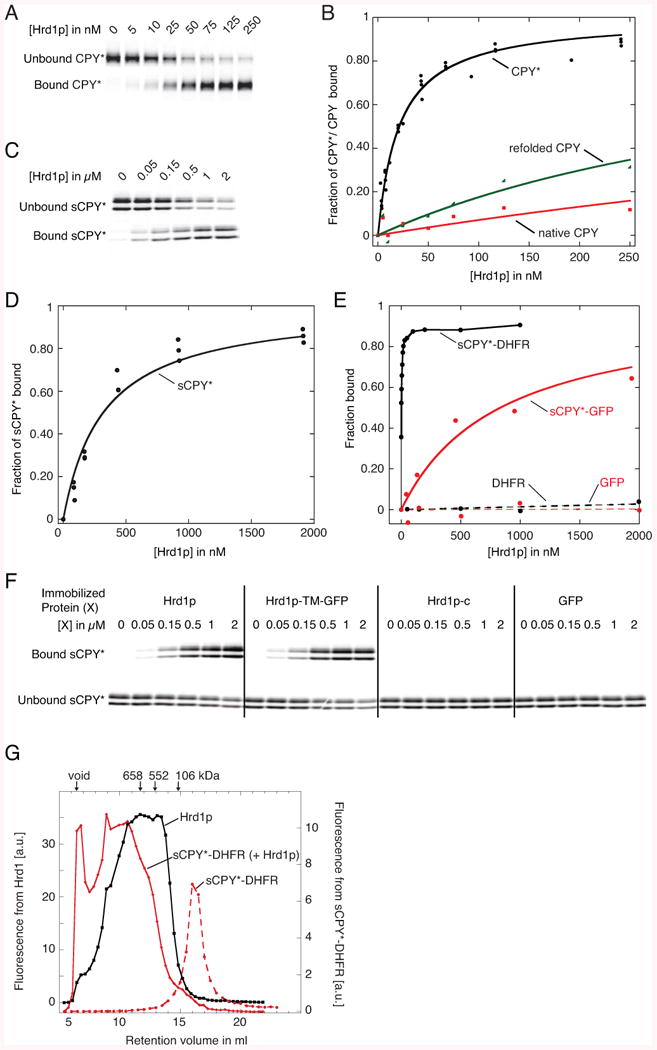
(A) Fluorescently labeled CPY* (10 nM) was incubated with increasing concentrations of bead-immobilized SBP-tagged Hrd1p (Hrd1p). The bound and unbound fractions were analyzed by SDS-PAGE and fluorescence scanning.
(B) Quantification of four different experiments as in (A). Fitting of the data points gives an apparent dissociation constant of 30 nM. Also shown are experiments with wild type CPY, either purified as a native protein or after unfolding and refolding, as done with CPY*.
(C) As in (A), but with sCPY* (100 nM).
(D) Quantification of three different experiments as in (C). The apparent dissociation constant is ∼300 nM.
(E) Quantification of binding experiments of wild type Hrd1p with fluorescently labeled sCPY*-DHFR (10 nM), sCPY*-GFP (100 nM), DHFR (100 nM), or GFP (100 nM).
(F) As in (C), but sCPY* was incubated with either wild type Hrd1p, a fusion of the TMs of Hrd1p with GFP (Hrd1p-TM-GFP), the cytoplasmic domain of Hrd1p (Hrd1p-c), or GFP.
(G) sCPY*-DHFR (200 nM) labeled with DyLight800 was incubated with a mixture of unlabeled Hrd1p (20 μM) and Hrd1p (200 nM) labeled with DyLight680. The sample was subjected to gel filtration in a buffer containing 120 μM DMNG and fractions were analyzed in two fluorescence channels. A control was performed with labeled sCPY*-DHFR alone. The arrows indicate the void volume, and the retention volume of size standards.
See also Figure S1.