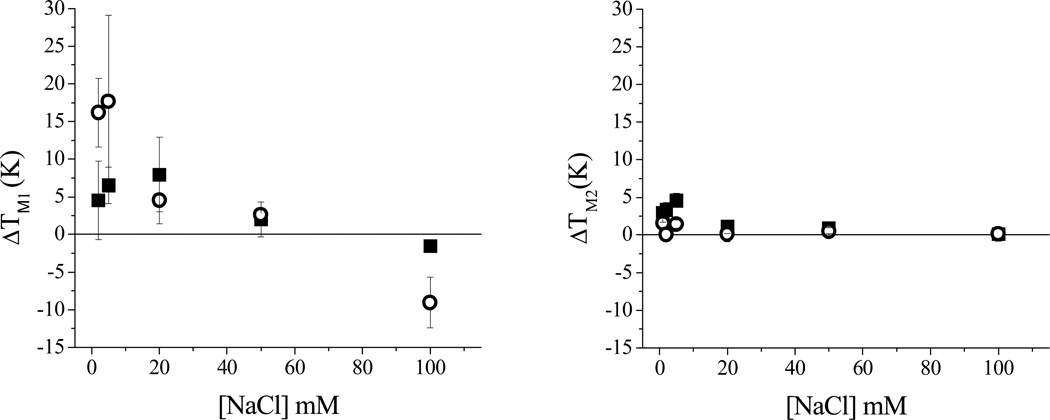
Figure 2.
Variation of shifts in IRES SLIIb melting temperature (ΔTM1 and ΔTM2) in the presence of peptides, relative to the SLIIb RNA alone (indicated by open triangles (top) or the black line (bottom)), SLIIb RNA and 50 µM GGHYrFK-amide (1) (black squares), and SLIIb RNA and 50 µM GGhyrfk-amide (2) (open circles). [RNA] = 1 µM; [peptide] = 50 µM, [HEPES] = 20 mM, pH = 7.4.

