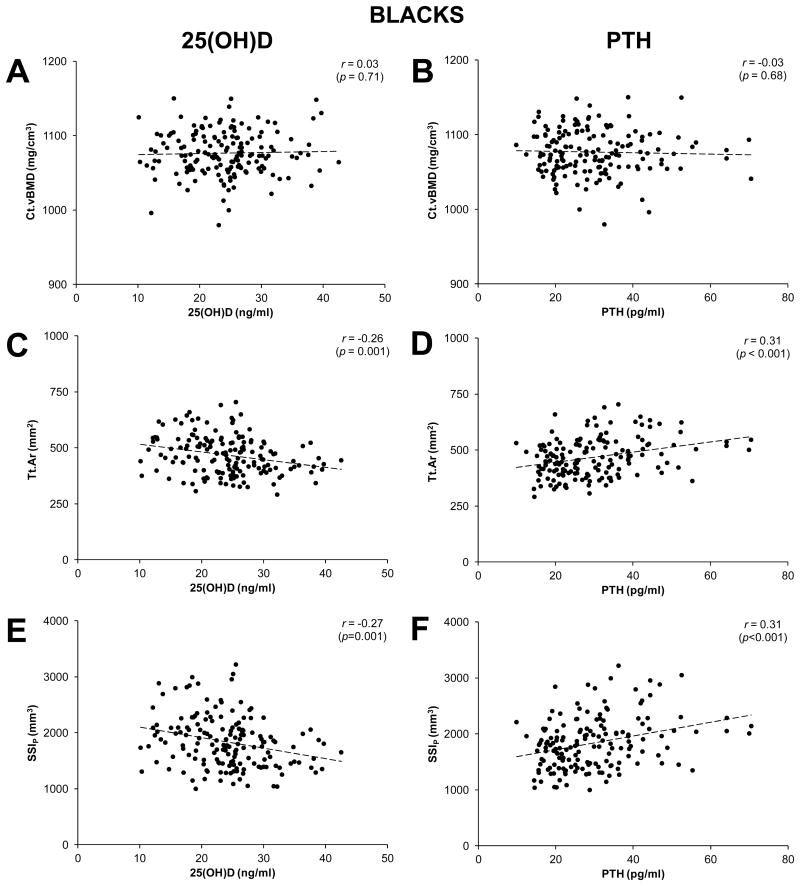
Figure 3.
Scatterplots illustrating the relationships between cortical bone properties (cortical volumetric bone mineral density [Ct.vBMD], total area [Tt.Ar], polar strength-strain index [SSIP]), and serum concentrations of 25-hydroxyvitamin D [25(OH)D] (panels A,C,E) and parathyroid hormone (PTH) (panels B,D,F) in blacks. Curve fitting revealed variables were linearly related, as opposed to quadratic, cubic, exponential or logarithmic. r-values represent Pearson's bivariate correlations.

