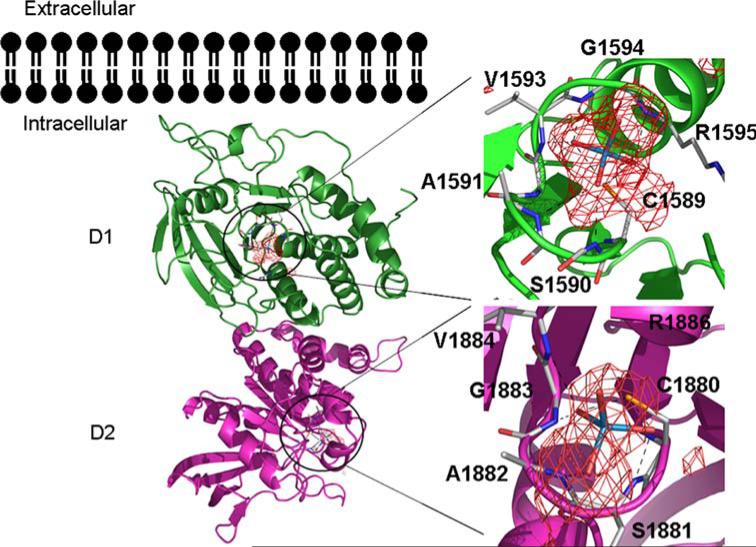
Fig. 3.
Structure of the human PTPσ tandem phosphatase domains. The structure of the PTPσ tandem phosphatase domains D1 and D2 is shown as a ribbon diagram with bound tungstate ions as stick and overlapping anomalous difference electron density in red. Domain D1 is shown in dark green and D2 in magenta. Interactions with the tungstate ion in the D1 and D2 active sites are magnified with hydrogen bonds represented as black dashes

