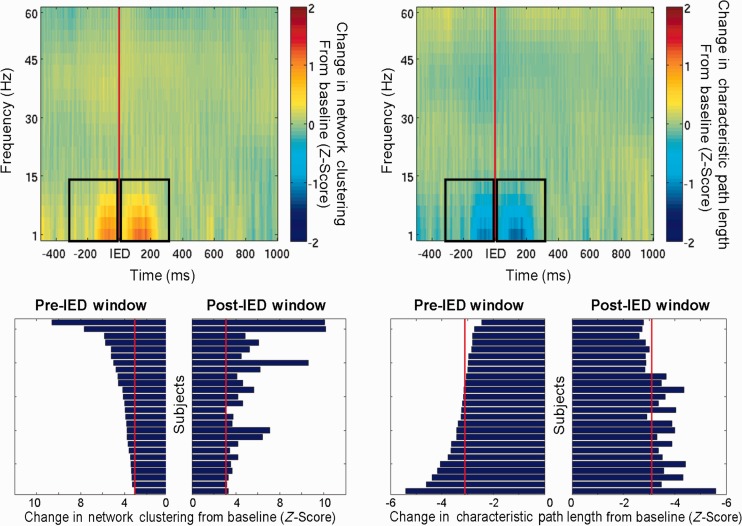
Figure 3.
IED-locked changes in network topology. Top: Average event-related network changes for all subjects showing an increase in mean network clustering and a decrease in characteristic path length both preceding and following IEDs, suggesting a shift away from a small-world network. Black boxes represent pre- and post-IED windows. Bottom: Changes in network topology within pre- and post-IED windows amongst all subjects. Greater changes reflect more vulnerable topologies, whereas smaller changes reflect resilience. Red line denotes Bonferroni-corrected threshold (P < 0.05; corrected across subjects) for significant changes from baseline within defined interval.

