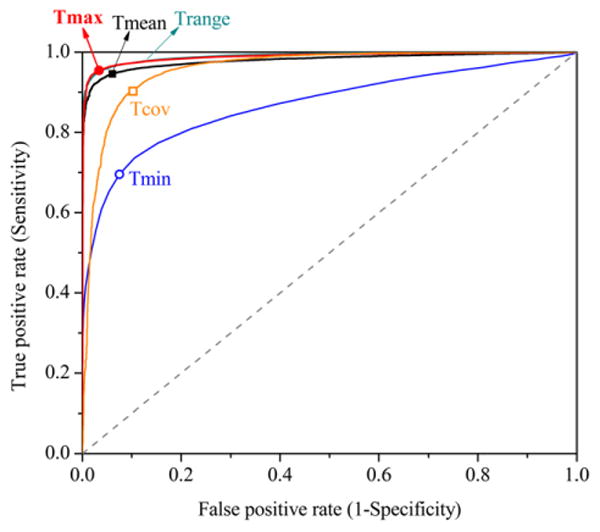
Fig. 7.

ROC curve comparing the specificity and sensitivity to detect daily use of different thresholds, compared to the determination of use by peak detection. Lines passing through the left top corner have higher sensitivity and higher specificity and are preferred. Each line represents the sensitivity–specificity combinations for different threshold values of a temperature distribution. The marked points represent specific thresholds for the daily maximum (T0 = 26 °C), mean (T0 = 19 °C), range (T0 = 11 °C), minimum (T0 = 16 °C) and coefficient of variation (17%) for the 31,112 stove-days monitored.
