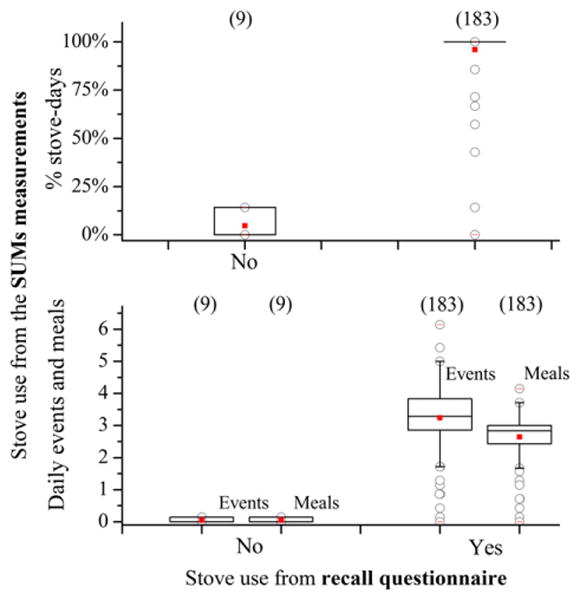
Fig. 8.

Chimney cookstove usage from recall questionnaires (horizontal axis) showed good agreement with the percent days of use (above) and the daily meals and events (below) measured with the SUMs (vertical axis) during the 15 days preceding the questionnaire. The centerline represents the median, the squared red dot the mean value and the box encloses the interquartile range (25th–75th percentile). The whiskers depict the 5th and 95th percentiles, and values outside the whiskers are outliers. The sample size of each group is shown in parenthesis (For interpretation of the references to colour in this figure legend, the reader is referred to the web version of this article.)
