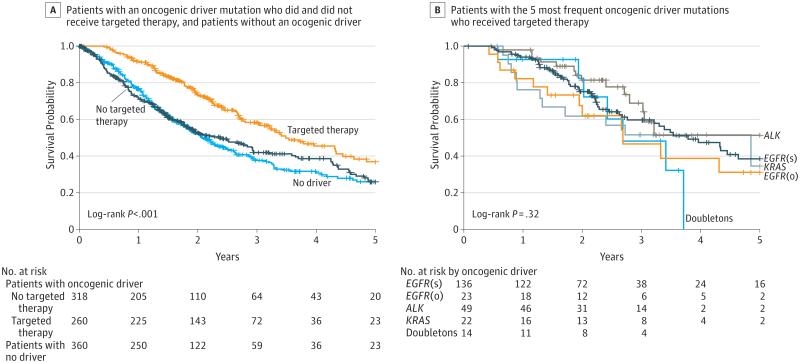
Figure 2. Survival Comparisons.
ALK indicates anaplastic lymphoma kinase gene; EGFR(s), epidermal growth factor receptor gene (sensitizing); EGFR(o), epidermal growth factor receptor gene (other); KRAS, Kirsten rat sarcoma; NA, not applicable.
A, Median survival (95% CI): oncogenic driver + no targeted therapy, 2.38 (1.81-2.93); oncogenic driver + targeted therapy, 3.49 (3.02-4.33); no oncogenic driver, 2.08 (1.84-2.46). B, Survival by oncogenic driver detected for patients with the 5 most frequent oncogenic drivers and targeted treatment. Median survival (95% CI): EGFR(s), 3.78 (2.77-NA); EGFR(o), 2.70 (1.42-NA); ALK, NA (2.80-NA); KRAS, 4.85 (1.30-NA); doubletons (oncogenic drivers in 2 genes), 2.69 (1.94-NA). Vertical tick marks are censoring events.

