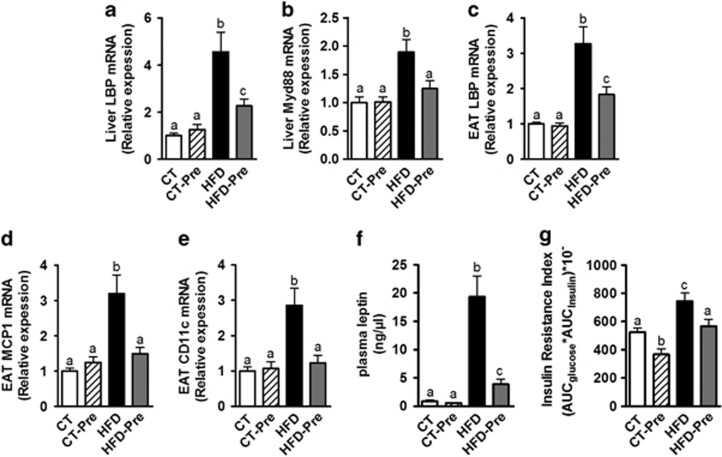
Figure 8.
Prebiotic treatment decreased inflammation, fat mass development and insulin resistance associated with HFD-induced obesity. Inflammatory markers mRNA expression: (a) LPS binding protein (encoded by LBP) and (b) Myeloid differentiation primary response gene (88) (encoded by Myd88) in the liver; (c) LPS binding protein (encoded by LBP); (d) Monocyte chemoattractant protein 1 (encoded by MCP1) and (e) Cluster of differentiation 11c (encoded by CD11c) in the epididymal adipose tissue (EAT); (f) Plasma leptin (ng μl−1) in cava vein and (g) Insulin resistance index determined by multiplying the area under the curve (from 0 to 15 min) of blood glucose and plasma insulin following an oral glucose load (2 g glucose per kg of body weight) measured in control diet-fed mice (CT) (n=9), CT diet-fed mice treated with prebiotics (CT-Pre) (n=10), HFD-fed mice (HFD) (n=10) and HFD-fed mice treated with prebiotics (HFD-Pre) (n=10). Data are means±s.e.m. Data with different superscript letters are significantly different (P<0.05) according to a post hoc ANOVA one-way statistical analysis.

