
Figure 1.
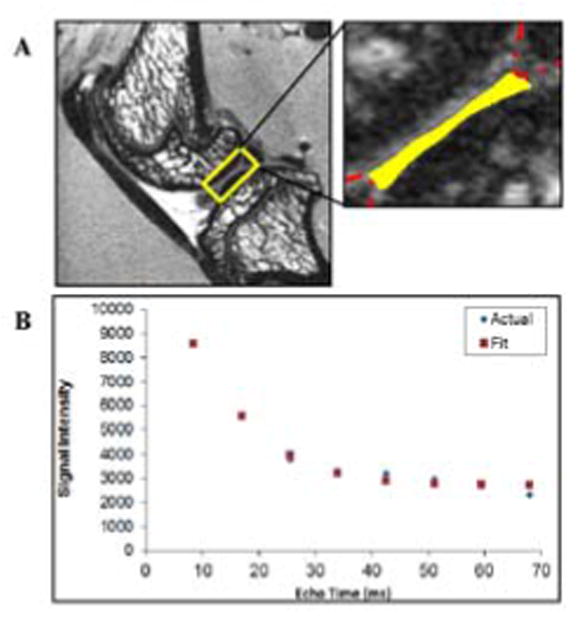
A T2 weighted sagittal image of the center of the lateral compartment of a rat knee joint. (A) A typical region of interest from which T2 relaxation data were assessed is outlined with the solid line.. In this case, the cartilage-cartilage contact area lining the tibial plateau is highlighted. The anterior and posterior aspects of the lateral meniscus are outlined with the broken line. (B) A representative curve fit plot showing the mean signal intensity of the 40 μm voxels in the ROI and the points on a best fit noise corrected exponential decay curve. This particular specimen had a T2 of 16.4 ms, (R2 = 0.99).