
Figure 1.
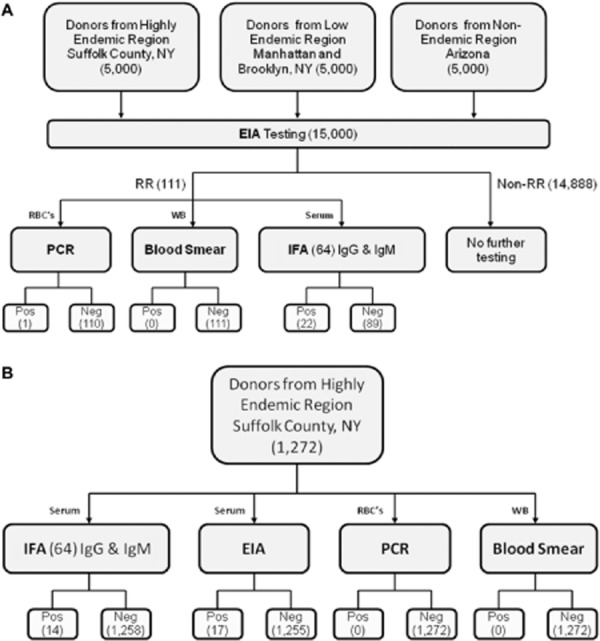
Flow charts showing the two arms of the study. Numbers in parentheses represent numbers of samples at each stage. RR = repeat reactive.
Official websites use .gov
A
.gov website belongs to an official
government organization in the United States.
Secure .gov websites use HTTPS
A lock (
) or https:// means you've safely
connected to the .gov website. Share sensitive
information only on official, secure websites.
Flow charts showing the two arms of the study. Numbers in parentheses represent numbers of samples at each stage. RR = repeat reactive.