
Figure 1.
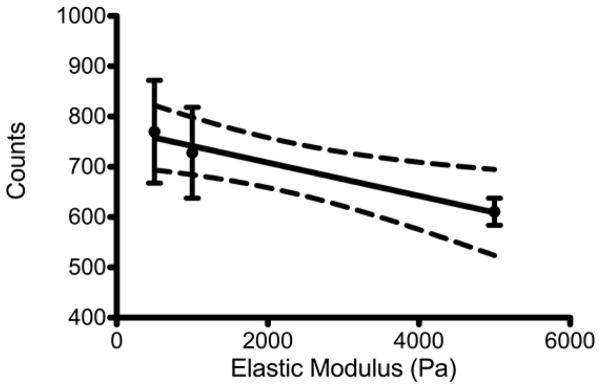
The number of ARPE-19 cells that phagocytosed a bead, per 10,000 cells (Counts) plotted versus the substrate stiffness (Elastic Modulus). The mean and standard error of the mean plotted with the results of a linear regression analysis. The dashed lines indicate 95% confidence intervals; p=0.0135; R2=0.4726.