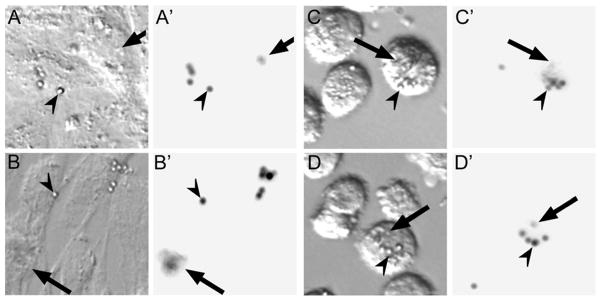
Figure 2.

Imaging of ARPE-19 cells, grown on a 1000 Pa gel, after incubation with beads. A&B: phase contrast image before trypsinization, A′&B′: fluorescence image before trypsinization, C&D: phase contrast images after trypsinization, C′&D′: fluorescence images after trypsinization. Arrowheads indicate beads that were not phagocytosed while arrows indicate beads that have been phagocytosed by the RPE cells.
