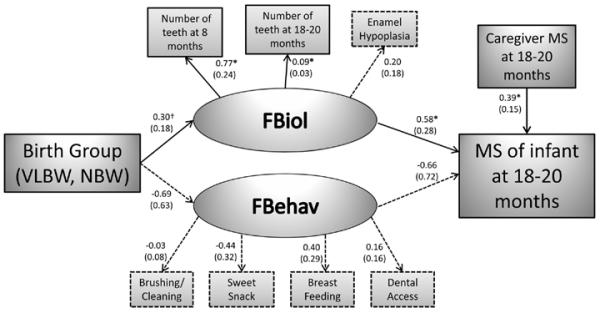
Figure 1.

Structural equation model of the pathway between birth group and Infant MS presence at 18-20 months.
The model involves four stages (in causal order): 1) socio-demographics (caregiver age, education, race, marital status) at birth; 2) birth group (VLBW, NBW); 3) latent variables for biology and behavior; caregiver MS levels at 18-20 months; 4) infant MS presence at 18-20 months. Solid arrows with *, denote the presence of a statistically significant (p <0.05) relationship. Dotted arrows denote non-significant (p >0.05) relationship. Solid arrow with † denote trend towards significance with p <0.10. Estimated coefficients with the standard errors for the estimates (in the parentheses) are displayed. The latent variables (FBiol and FBehav) were derived by using confirmatory factor analysis.
