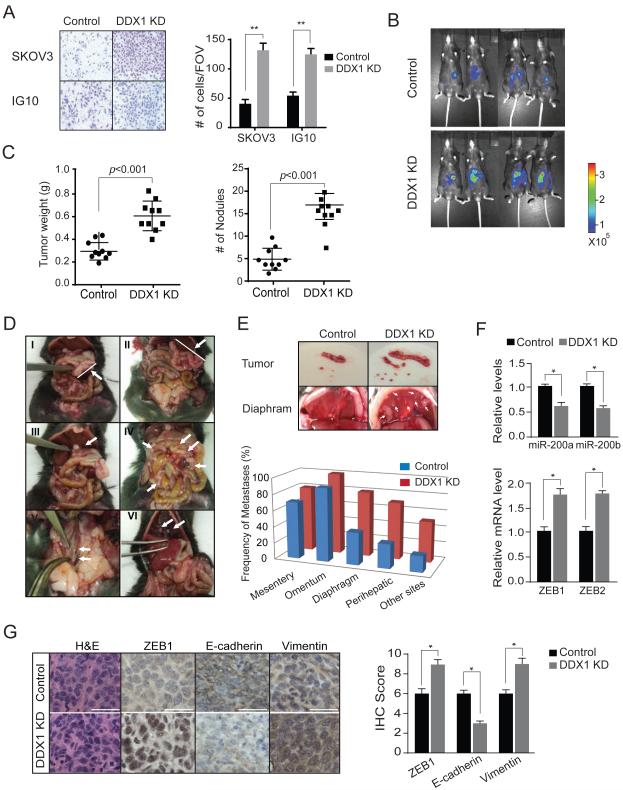
Figure 6. Silencing DDX1 promotes ovarian tumor cell invasion in vitro and ovarian tumor progression in vivo.
(A) Knockdown of DDX1 promotes ovarian tumor cell invasion. Matrigel invasion assays were performed on control or DDX1-knockdown SKOV3 and IG10 cells. Average numbers of invasive cells per field of view (FOV) were presented (**p < 0.001) (B) Knockdown of DDX1 promotes IG10 syngeneic tumor growth. Control and DDX1-knockdown IG10 cells expressing firefly luciferase were injected intraperitoneally into female C57BL/6N mice. Shown are the representative luciferase images of ovarian tumors. (C) Quantification of tumor weights and tumor nodules in mice (n = 10 for each group). Error bar represents the mean ± SEM. (D) Representative images of tumor nodules and metastases in the mice carrying syngeneic ovarian tumors derived from control and DDX1-knockdown IG10 cells. Shown here are tumor mass in omentum of a control tumor (I) and tumor mass in omentum (II), perihepatic area (III), mesentery (IV), lymph nodes (V), and diaphragm (VI) of DDX1-knockdown tumors. (E) Frequency of metastases to distant sites (mesentery, omentum, diaphragm, perihepatic and other sites). Other sites include paraaortic lymph nodes, kidney, and ovary. (F) Levels of miR-200a/b and their targets ZEB1 and ZEB2 in control and DDX-silenced tumors. Error bars represents the mean ± SD. (G) Immunohistochemical analysis of ZEB1, E-Cadherin and Vimentin in control and DDX1-knockdown ovarian tumors. Scale bar: 30 μm. Relative levels of ZEB1, E-Cadherin and Vimentin are shown in the graph (See Materials and Methods for IHC score, * p < 0.05). Error bars represents the mean ± SD.

